Nor’easters enhanced by a warm Atlantic Ocean following the Genesis Flood would have dumped large quantities of snow in eastern Canada.1 This could explain why the Laurentide Ice Sheet was thicker farther to the east in North America during the Ice Age.
A nor’easter is a type of synoptic scale storm that occurs along the east coast of the United States and the Atlantic coast of Canada. It is so named because the storm travels up the coast, and the winds spiral around the storm from the northeast in coastal areas. The storms sometimes have characteristics similar to a hurricane. They feature a low-pressure area with the center of the rotation just off the east coast and with leading winds in the left front quadrant rotating onto land.
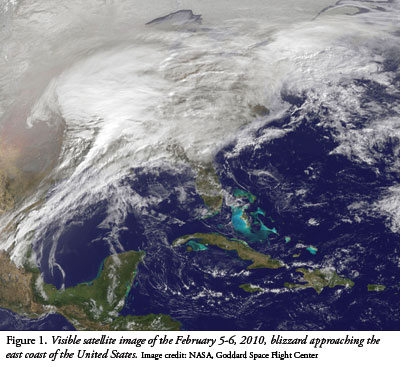 Figure 1 shows the North American blizzard of February 5-6, 2010, approaching the east coast of the United States. The precipitation pattern is similar to that of an extratropical storm. Nor’easters can cause severe coastal flooding, coastal erosion, hurricane-force winds, and heavy snow or rain. Nor’easters occur at any time of the year, but mostly in the winter.
A blizzard is a severe snowstorm characterized by strong winds. By definition, the difference between a blizzard and a snowstorm is the strength of the wind. To be defined as a blizzard, a snowstorm must have winds in excess of 35 miles per hour with blowing or drifting snow that reduces visibility to one-fourth of a mile or less and must last for a prolonged period of time—typically three hours or more. Blizzards can bring near-whiteout conditions and can paralyze regions for days at a time, particularly where snowfall is rare. The blizzard of February 5-6, 2010, closed down most transportation in the nation’s capital for almost a week.
Nor’easters can be devastating, especially in winter months when most damage and deaths are cold-related. The storms are known for bringing extremely cold air southward from the Arctic. They thrive on the temperature contrast between converging polar air masses and warm ocean water off the North American coast.
Researchers Michael Oard, Steve Austin, and others have argued that heat released from catastrophic processes of the Genesis Flood would have heated the oceans.2, 3 Drilling of ocean sediments led researchers to conclude that the oceans were at least 36°F hotter in the past. Also, oceanographic cartographers Bruce Heezen and Marie Tharp published images of the ocean floor obtained in the 1960s that show mid-ocean ridges and undersea volcanoes that likely released large quantities of heat during past earth upheavals.4 Higher sea-surface temperatures would have evaporated large quantities of water vapor from the oceans, energized mid-latitude storms and hurricanes, and precipitated large quantities of rain and snow on the continents.
My study with computational engineer Wesley Brewer hypothesized that warmer than normal oceans would have energized nor’easters, generated larger and more intense circulations, and produced heavier precipitation farther inland over large regions of the northeastern United States and southeastern Canada for several hundred years following the Genesis Flood.1 The greater frequency and more intense nor’easters that probably developed during the Ice Age would have likely contributed significant quantities of snow to the Laurentide Ice Sheet in eastern Canada and the eastern United States. The study analyzed the wind and precipitation fields for three simulated nor’easters to determine how much they would have been enhanced by a warmer Atlantic Ocean. The three storms were different meteorologically and typified nor’easters that commonly occur on the east coast of the United States.
We compared the three actual nor’easters and the simulated storms to ensure that the numerical model used faithfully replicated them. The sea-surface temperatures in the Atlantic were then artificially warmed by 18°F, and the storms were re-analyzed for any changes.
The North American Blizzard of February 5-6, 2010
One of the three storms—Snowmaggedon, the blizzard that became a nor’easter once it reached the east coast—will be discussed briefly here to illustrate some of the effects of a warm Atlantic Ocean. Snowmaggedon was a severe weather event that tracked from California to Arizona through northern Mexico, the American Southwest, the Midwest, Southeast, and mid-Atlantic regions. The storm caused extensive flooding and landslides in Mexico, as well as historic snowfall totals in the mid-Atlantic states. The storm stretched from Mexico and New Mexico to New Jersey before moving out to sea, and then turned north to impact the Maritime Provinces of Canada. The storm caused deaths in Mexico, New Mexico, Maryland, and Virginia.
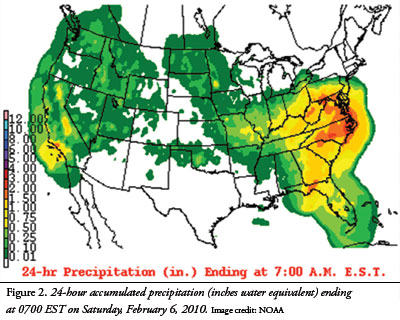
Blizzard conditions were reported in a relatively small area of Maryland, but near-blizzard conditions occurred throughout a large part of the mid-Atlantic region. Additionally, some places across eastern West Virginia, Maryland, northern Virginia, Delaware, southwestern Pennsylvania, south central Pennsylvania, southeastern Pennsylvania, southern New Jersey, and Washington, D.C., received between 20 to 40 inches of snow, bringing air travel and interstate highway traffic to a halt. Rail service was impacted as well—it was suspended south and west of Washington, D.C., and only limited service was available between Washington, D. C., and Boston.
The pressure-height contours, isotherms, and winds at about 5,000 feet above sea level over the United States were studied, as well the 24-hour accumulated precipitation ending at 0700 EST on Saturday, February 6, 2010. The heaviest precipitation occurred in the mid-Atlantic region (see Figure 2).
The Enhanced Storm
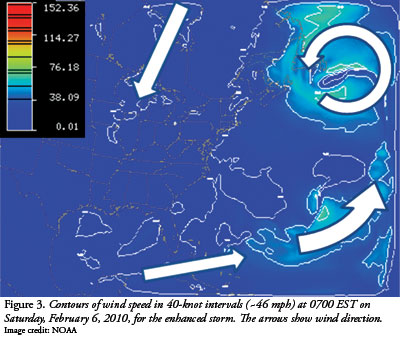 When the sea-surface temperature was artificially warmed to 104°F, the winds throughout the storm greatly increased, the circulation pattern shifted eastward and northward, and the precipitation rate was much higher. Figure 3 shows the contours of wind speed at 5,000 feet above sea level at 0700 EST on Saturday, February 6, 2010, for a sea-surface temperature of 104°F over the eastern United States. Wind speeds exceeded 120 knots (~137 mph) in the Atlantic Ocean east of Maine—faster speeds than the winds in a Category 2 hurricane. Notice that a strong northeasterly flow occurred along the entire east coast. The wind speeds were over twice that of the actual storm, and the center of circulation was farther east and to the north. Over land, the enhanced storm winds exceeded 40 knots (~46 mph) along most of the coast. But in Maine, Quebec, and Newfoundland, winds exceeded 100 knots (~114 mph). Severe blizzard conditions would occur under these conditions if the temperature were cold enough to produce snow.
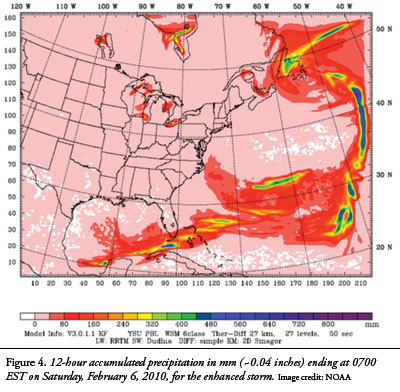 Figure 4 shows the 12-hour accumulated precipitation ending at 0700 EST on Saturday, February 6, for the enhanced February 5-6, 2010, North American blizzard. Most of the heaviest precipitation occurred far off the east coast in the Atlantic, where the storm dynamics were the strongest. The accumulated precipitation exceeded 40 inches of water equivalent per 12 hours over several locations of the ocean and about two inches over most of the domain, except in the southern states and the northern part of the Gulf of Mexico. In addition, precipitation exceeded about four inches around Newfoundland, New Brunswick, and in the ocean just south of Maine. The counterclockwise circulation around this enhanced storm also extended to long distances and produced snow streaks southward from Hudson Bay and the Great Lakes. The model calculations showed that over 20 inches of snow would have fallen during 24 hours in Canada and the northeastern United States. Two other typical nor’easters were successfully simulated in this study and produced similar results to the February 5-6, 2010, blizzard described previously.
Conclusions
When the surface temperature of the Atlantic Ocean was theoretically warmed to 104°F, all three nor’easters were invigorated, wind speeds were increased, new circulation patterns emerged, and precipitation was increased and redistributed. In one of the enhanced cases, the winds exceeded a Category 5 hurricane.
Even with the heaviest precipitation falling over the Atlantic Ocean in these simulations, precipitation of about eight inches per 24 hours would have built a mountain of snow and ice over southeastern Canada. Brewer and I suggested that a storm would have formed and moved across the United States every three days all year round. This would have produced an uncompressed snow pack of about 200 feet per year. Upon compression to solid ice, an ice layer would have grown to about 4,000 feet in 100 years. If bands of additional precipitation were swept around the centers of circulation of enhanced nor’easters off the coast of New England, the accumulation would have been even greater. The additional snow from enhanced nor’easters would explain a thicker Laurentide Ice Sheet in eastern Canada during a recent ice age.
Acknowledgments
The mesoscale model (Weather Research and Forecasting) and data used in this study were developed and maintained by the National Center for Atmospheric Research (NCAR). NCAR is sponsored by the National Science Foundation (NSF). This research was funded by the National Creation Research Foundation at the Institute for Creation Research.
References
- Vardiman, L. and W. Brewer, 2012. Numerical Simulations of Three Nor’easters with a Warm Atlantic Ocean. Answers Research Journal. 5: 39-58.
- Oard, M. 1990. An Ice Age Caused by the Genesis Flood. El Cajon, CA: Institute for Creation Research.
- Austin, S. A. et al.1994. Catastrophic plate tectonics: A global flood model of earth history. In Proceedings of the Third International Conference on Creationism. Walsh, R. E. ed., Pittsburgh, PA: Creation Science Fellowship, 609-621.
- Heezen, B. and M. Tharp. 1977. Map of the world ocean floor. Office of Naval Research, Columbia University.
* Dr. Vardiman retired from the Institute for Creation Research in June 2012 as Senior Research Scientist in Astro/Geophysics.
Cite this article: Vardiman, Larry. 2013. A Mountain of Snow after the Genesis Flood. Acts & Facts. 42 (1): 16-18.


