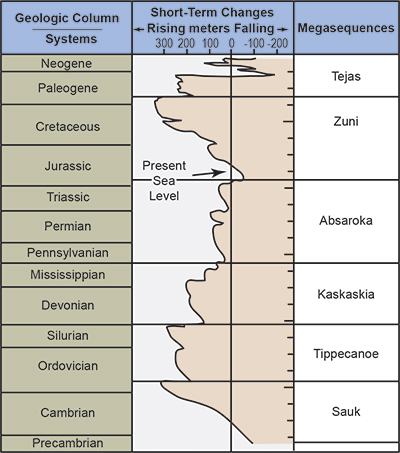
 Evolutionary geologists compiled a global sea level curve from the Cambrian system to the present using assumed environmental interpretations and deep time (Figure 1).1 They infer global sea level was lower during deposition of the Permian system because they believe that many sedimentary layers, like the Permian Coconino Sandstone, were deposited across dry land. For this reason, they show a lowering of sea level during the Permian. But creation geologist John Whitmore has shown that the rock data better support deposition in a marine setting—further evidence for the global Flood of Noah’s day.2
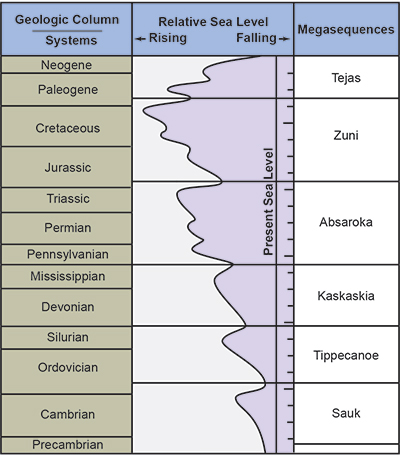
ICR compiled stratigraphic data from over 1,500 columns across North and South America and Africa. These data have allowed us to clarify the true nature of global sea level. If we look only at the extent and volume of the rocks across these continents, we see that the generally accepted secular sea level curve doesn’t match the actual rock data. Instead, we see evidence of a single, progressive flood event that began slowly in the Sauk Megasequence, peaked in the Zuni, and receded in the Tejas (Figure 2). All of the continents show the same general pattern, making the result even more compelling.
To create our new sea level curve, we used the maps and sedimentary data we compiled across three continents. Table 1 shows the surface area, volume, and average thickness of each megasequence across each continent and the global totals. Collectively, these data show limited amounts of sediment deposited in the earliest megasequences. All three continents show progressively greater accumulations until the maximum volume is reached in the Zuni. The subsequent Tejas, although likely the receding phase of the Flood, is second in volume and extent to the Zuni.
The evidence for a single, progressive flood is probably best shown by the sedimentary patterns across Africa. Here, the Sauk through Kaskaskia show the least surface extent, followed by more and more coverage, until the Flood reached its maximum level during the Zuni, likely Day 150 of the Flood. Unsurprisingly, the Tejas shows a nearly identical amount of surface extent as the Zuni; recall, the Tejas was the receding phase that began on Day 150. The surface extent of both should be nearly identical, barring subsequent erosion.
Note in Table 1 the massive jump in sediment volume and extent in the Absaroka Megasequence across the three continents. We interpret this as about Day 40 in the Flood, when the Ark began to float (Genesis 7:17). It also coincides with the first major coal seams and the first occurrences of numerous land fossils in the rock record. Also note the even greater jump in volume and extent in the Zuni. This is when the dinosaurs were completely inundated and the water levels reached their peak around Day 150.3
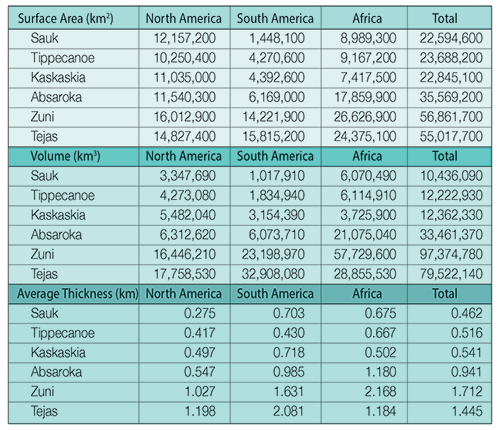
The totals column on the far right side of Table 1 also confirms the Flood account. These data indicate a flood event that began slowly, reached a maximum in the Zuni, and then receded. This is why the Zuni has the maximum volume, thickness, and extent of sedimentary rocks globally. It was the high point of the Flood—Day 150.
Simultaneous sedimentary patterns across multiple continents are strong evidence of a global flood. ![]()
There is no other reasonable way to explain these data. Simultaneous sedimentary patterns across multiple continents are strong evidence of a global flood. The secular sea level curve, based on evolutionary biases, is wrong.
References
- Vail, P. R. and R. M. Mitchum, Jr. 1979. Global Cycles of Relative Changes of Sea Level from Seismic Stratigraphy. American Association of Petroleum Geologists Memoir. 29: 469-472.
- Whitmore, J. H. and R. Strom. 2009. Petrographic Analysis of the Coconino Sandstone, Northern and Central Arizona. Geological Society of America Abstracts with Programs. 41 (7): 122.
- Clarey, T. L. and D. J. Werner. 2017. The Sedimentary Record Demonstrates Minimal Flooding of the Continents During Sauk Deposition. Answers Research Journal. 10: 271-283.
* Dr. Clarey is Research Associate at the Institute for Creation Research and earned his Ph.D. in geology from Western Michigan University.