



Introduction
In the latest of my series of articles on global warming, I offered evidence that global warming appears to be occurring, but evidence seems to be growing that fluctuations in the electromagnetic field of the sun may be responsible for it.1 Here I would like to expand my arguments that carbon dioxide from man's activities is probably not the primary cause for global warming. Major weaknesses have developed in the logic that carbon dioxide causes global warming. In a second article to follow, I will describe a new theory of climate change based on the influence of the sun.
Arguments against Carbon Dioxide Driving Global Warming
In his presentation An Inconvenient Truth,2 Al Gore argues that the correlation between earth's average global temperature and the concentration of carbon dioxide in the atmosphere irrefutably demonstrates that carbon dioxide drives global warming. He compares the temperature trend in the so-called "Hockey Stick Diagram" with the exponential increase in carbon dioxide measured at Mauna Loa, Hawaii, for the past 50 years. A similar plot of temperature over the past 1,000 years is shown in Figure 1. Such a diagram is given this name because the temperature plot looks like a long-handled hockey stick. This figure shows a superposition of average global temperature curves obtained by different research groups using different data and/or methodologies. For example, the red curve shows the results obtained by Moberg et al,3 while the blue curve shows the results of Esper et al.4 The average temperature in the "handle" of the hockey stick over the period from about 1000 to 1850 A.D. remains relatively uniform, followed by a sudden rise in the "blade" since 1850, supposedly following the recent increase in carbon dioxide.
Figure 1 seems to provide compelling evidence that global warming is caused by an increase in carbon dioxide. The sudden steep rise in temperature following a long period of uniform temperature prior to the Industrial Age seems to be inextricably linked to man's activities since 1850 or so. However, when one examines the figure more carefully, the argument begins to fall apart.
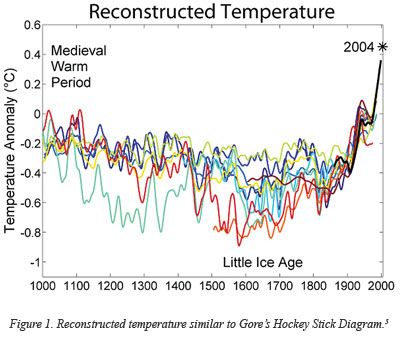
The "Hockey Stick Diagram" has recently come under critical scrutiny. Most paleoclimatologists work with more widely-accepted temperature plots which have been used for many years in standard climate research and textbooks. These individual charts contain wide variations in temperature over the past 1,000 years, in opposition to the impression given by Gore's temperature diagram. In fact, they normally show a 400-year-long warm period from about 1000 to 1400 A.D., which is known as the Medieval Optimum in Europe. During this period crops flourished, the economy boomed, and the Vikings settled parts of Greenland where the ice sheets had melted back. From about 1400 to 1900 A.D., a 500-year cold period occurred. Certain crops like grapes could no longer be grown, the economy declined, and the Vikings were forced out of Greenland by the encroaching snow and ice. Sunspots were found to be fewer during this time period, which became known as the Maunder Minimum. The coldest center portion of this period with the fewest number of sunspots is called the Little Ice Age. The canals in Holland, unlike today, froze over each winter. These changes in temperature associated with sunspot number suggest that the sun may influence the climate over millennial cycles. However, studies over many years have not been able to confirm a convincing physical mechanism between sunspots and weather or climate.
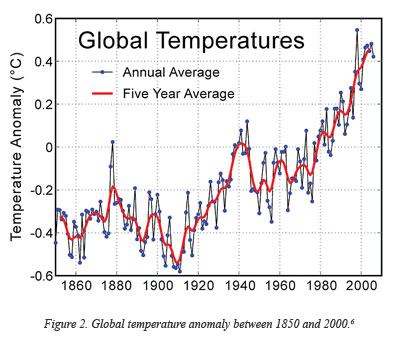
When the temperature trend in the "blade" of the hockey stick between 1850 and 2000 is examined in more detail, as shown in Figure 2, it is found that the average global temperature doesn't increase exponentially like the measurements of carbon dioxide do at Mauna Loa. The temperature increases between about 1850 and 1940, and then decreases for a 30-year period from 1940 to 1970, after which it begins to climb again. This is very peculiar if carbon dioxide is driving global temperature, because the greatest increase in output from industrial production and the associated release of carbon dioxide would have occurred during this period. Following World War II, industrial productivity and the release of carbon dioxide climbed rapidly. Yet temperature fell, prompting many climatologists to express concern that we were heading into another ice age. Once again, the average global temperature began to warm in 1970. The temperature and carbon dioxide diagrams do not match up, as one would expect if carbon dioxide concentration is driving temperature.
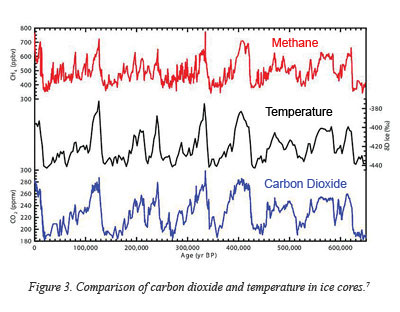
Gore also uses an argument that the correlation between carbon dioxide concentration and temperature in ice core records from the distant past, as shown in Figure 3, demonstrates that carbon dioxide and temperature are strongly related. However, a statistical correlation between two variables doesn't determine which one is causing the relationship and which one is responding. If one looks at these data in finer detail, as shown in Figure 4, it becomes evident that temperature is driving the carbon dioxide concentration, not the other way around. Changes in temperature trends led similar features in carbon dioxide and methane by some 800 years in this analysis. One explanation for this relationship is that warming of the oceans releases carbon dioxide to the atmosphere, increasing its concentration. This is likely due to the fact that the oceans contain much more carbon dioxide than the atmosphere, and they release carbon dioxide at warm temperatures and absorb it at cool temperatures.
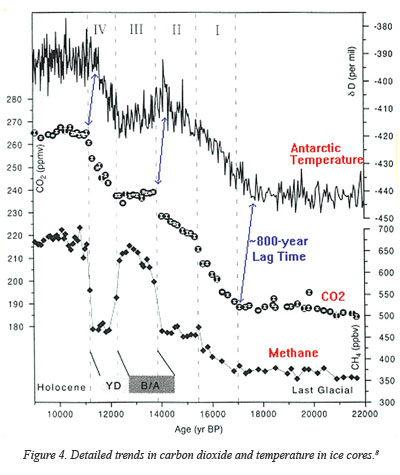
A qualifying statement must be made regarding the data shown in Figures 3 and 4. The horizontal scales shown in the figures assume an old earth. The correlations may be valid, but the actual ages and lags must be much less if one accepts a young earth.
Conclusions
Individual temperature records commonly used by climatologists and paleoclimatologists show that the past 1,000 years have been marked by periodic warm and cold periods, not by a uniform climate trend. The recent warming trend since about 1850 appears to be the continuation of the warming following the Little Ice Age, rather than a sudden upsurge after a long period of relatively uniform temperatures. The detailed temperature record since 1850 shows a temperature decline between 1940 and 1970, which flies in the face of the explanation that a continuous exponential increase in carbon dioxide causes global warming. And the simultaneous record of temperature and carbon dioxide concentration in ice cores indicates that carbon dioxide concentration changes after temperature changes, not before, indicating that carbon dioxide is the result, not the cause, of global warming.
References
- Vardiman, L. 2007. Evidence for Global Warming. Acts & Facts. 36 (4).
- Gore, A. 2006. An Inconvenient Truth. DVD directed by Davis Guggenheim; Paramount Vantage and United International Pictures, Theatrical Distributors. Book published by Rodale Press, Emmaus, PA.
- Moberg, A. et al. 2005. Highly variable Northern Hemisphere temperatures reconstructed from low- and high-resolution proxy data. Nature. 433 (7026): 613-617.
- Esper, J., E. R. Cook, and F. H. Schweingruber. 2002. Low-Frequency Signals in Long Tree-Ring Chronologies for Reconstructing Past Temperature Variability. Science. 295 (5563): 2250-2253.
- Robert A. Rohde, www.globalwarmingart.com/wiki/Image:1000
_Year_Temperature_Comparison_png. - Robert A. Rohde, www.globalwarmingart.com/wiki/Image:Inst
rumental_Temperature_Record_png. - Thomas Stocker, posted to "650,000 years of greenhouse gas concentrations," RealClimate.org on December 1, 2005.
- Figure from John L. Daly, Temperature-to-CO2 Proved, posted on John-Daly.com April 19, 2001, adapted from Figure 1 in Monnin, E. et al. 2001. Atmospheric CO2 Concentrations over the Last Glacial Termination. Science. 291 (5501): 112-114.
* Dr. Vardiman is Chair of the Department of Astro/geophysics.
Cite this article: Vardiman, L. 2008. Does Carbon Dioxide Drive Global Warming? Acts & Facts. 37 (10): 10.