Numerical Climate Modeling at ICR
Taken from Acts & Facts - April 1998
Taken from Acts & Facts - April 1998
ICR has been simulating the earth's climate using numerical climate models for over ten years. The first project calculated the vertical temperature distribution beneath a water vapor canopy surrounding the earth. Dave Rush, a graduate student at ICR, constructed a one-dimensional numerical model using a radiation code developed by the U.S. Air Force called LOWTRAN. He was successful in showing that vapor canopies of several different densities could be sustained in the upper atmosphere by solar heating. Unfortunately, he found that a strong greenhouse effect under water vapor canopies caused surface temperatures as high as 400°F.
By selectively choosing an optimum solar constant, surface albedo, solar zenith angle, cirrus cloud base, and cirrus cloud thickness, Dr. Larry Vardiman was able to show, in additional canopy studies, that the water content of a canopy could be as much as three feet of liquid water without the surface temperature reaching temperatures which would destroy life on the earth. Although this result is disappointing for advocates of a vapor canopy, the story may not yet be complete. It is possible that the high albedo produced at the top of a cloud layer in the canopy may reduce the flux of radiation into the canopy, greatly reducing the heating. Future modeling should include this effect.
In 1993 a new global climate model (CCM1) was acquired from the National Center for Atmospheric Research. Prior to its use at ICR, the model had only been run on a CRAY computer. Although running many times slower and saving only highly selected output, the model nevertheless has been giving very useful results.
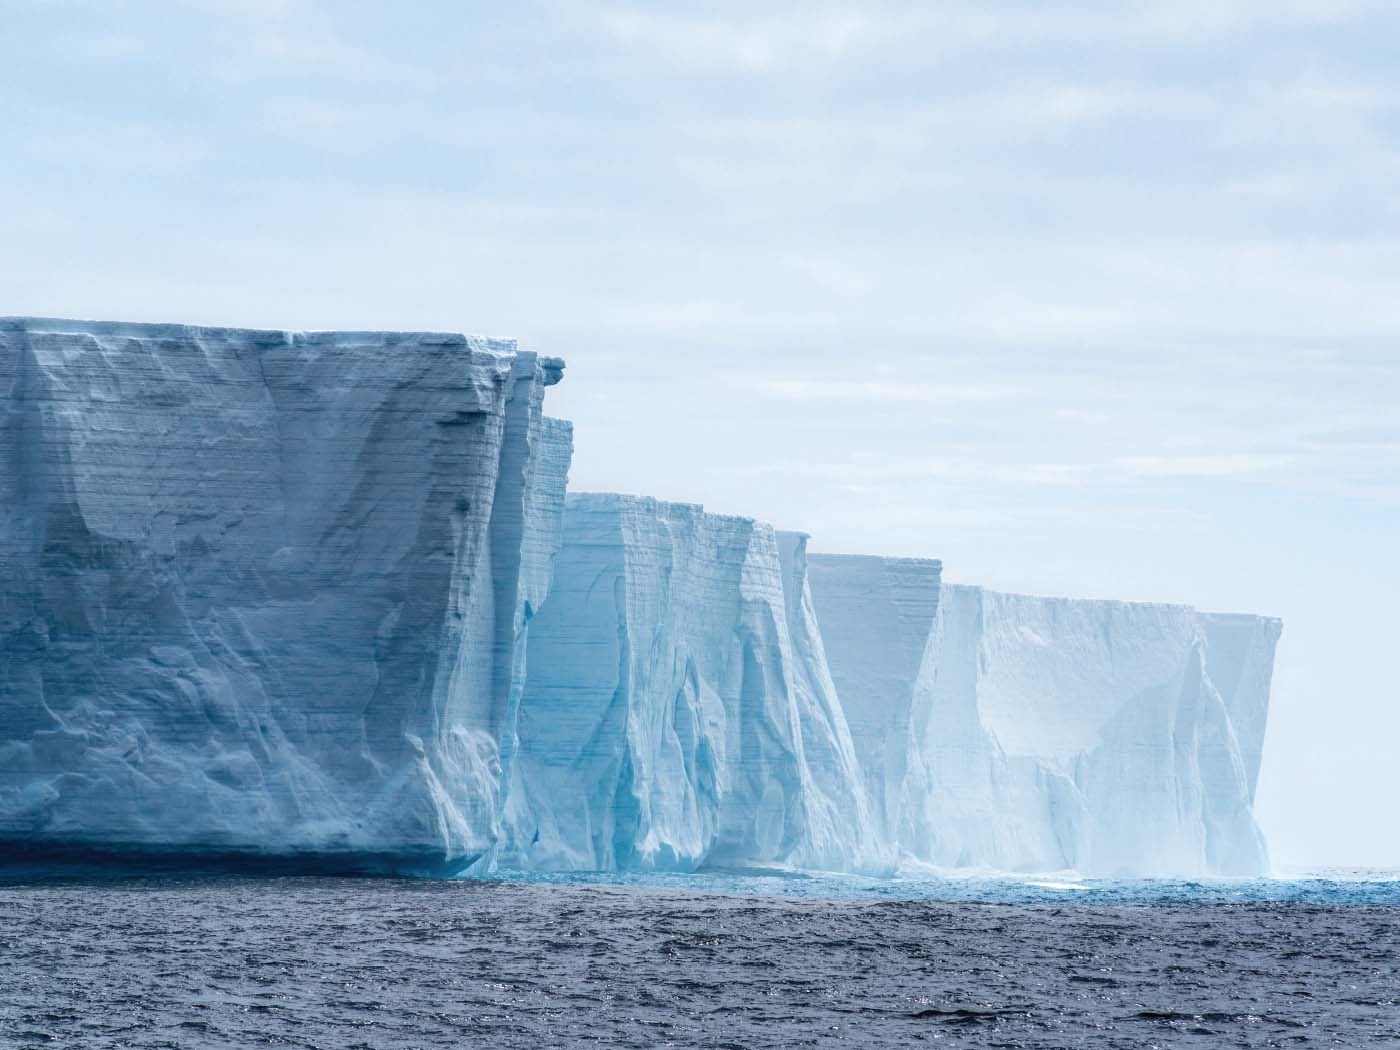
Karen Bousellot, another ICR graduate student, completed her M.S. thesis using the model to study the post-Flood climate with a warm sea-surface temperature. The assumption made in her research was that the oceans were left warmer than today due to all the heat and energy released in the events of the Flood. She found that wind speeds were about 25% stronger with warmer ocean temperatures than today. More precipitation falls at higher ocean temperatures, with much of it falling in mid to high latitudes and the polar regions. Precipitation exceeded 20 millimeters a day over large portions of the polar regions and along continental boundaries. Ice sheets in Greenland and Antarctica could have accumulated in less than 500 years under the simulated conditions.
Similar results were obtained in additional studies by Dr. Larry Vardiman when the ocean surface was warmed only over the current positions of mid-ocean ridges. This result implies that the entire ocean may not have been warmed by the Flood causing heavy precipitation in the polar regions, but only in selected areas where magmatic events were the most energetic.
A third model is currently being adapted to run on new Pentium PCs recently donated to ICR. The Mesoscale Meteorology Model (MM5) developed at Pennsylvania State University is now up and running, but still has to be tested to ensure it is giving reliable results. This model offers the opportunity to study meteorological processes in scales from continental size down to less than a mile. Fine resolution studies may be nested within coarser grids of data. MM5 will be used by graduate students and other researchers to study the development and movement of hurricanes over hot ocean regions near mid-ocean ridges. It will also be used to study precipitation rates over mountainous regions of the Colorado River Basin during the Ice Age when mountain barriers may have been much taller because of the heavy accumulation of snow and ice.
ICR has become a major numerical research center in paleoclimatology. Many donors have graciously given computer equipment and monies to permit this center to be established. We believe the next ten years will see major advances in our understanding of Earth's climate before, during, and following the Genesis Flood.
More Impact
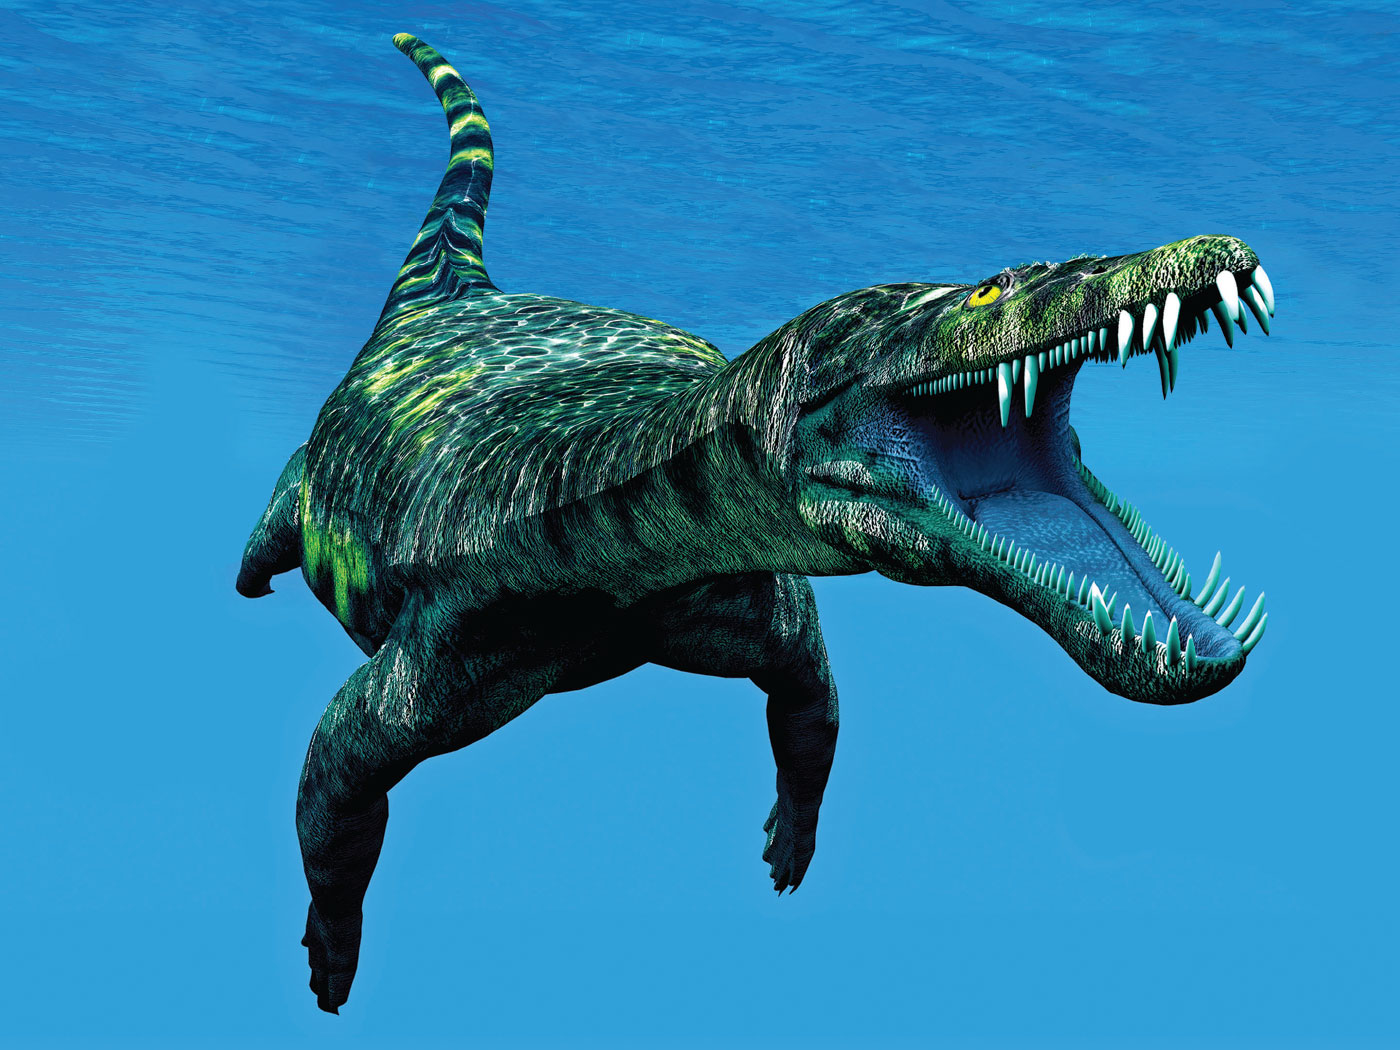
Dragon Art Defies Millions of Years
Of all the displays in the 30,000 square feet of the ICR Discovery Center for Science & Earth History in Dallas, the Dragon Encounters exhibit has...
Transposable Elements: Genomic Parasites or Engineered .,.
Transposable elements (transposons or TEs) are a specialized group of DNA sequences that can transpose or change positions in the genome. Some scientists...
ICR Ice Core Research Continues
Creationists think the thick ice sheets of Greenland and Antarctica began forming just 4,500 years ago during a short Ice Age triggered by the Genesis...
Shop Related Products