 In a scientific controversy, how do laypeople evaluate the merits of each side’s arguments when those arguments involve technical details? Unfortunately, many people simply assume that the majority’s arguments and conclusions are correct. This is certainly true in the creation-evolution debate, where most scientists make claims that clearly contradict Scripture.
However, a situation occasionally arises in which it is possible for laypeople to verify for themselves whether a claim is true or not. Creation scientists are delighted when this happens since Christians should be testing our claims, as well as those of other teachers, to see if they are true (Acts 17:11; 1 Thessalonians 5:21).
This article shows how you can confirm for yourself, using a simple pocket calculator, that an iconic old-earth claim about past “climate change” has long been invalid.1 Although understanding this argument may take some effort, remember the words of Ecclesiastes 7:19: “Wisdom strengthens the wise more than ten rulers of the city.” It is my prayer that you’ll feel greatly empowered by your ability to verify these results for yourself without having to take anyone’s word for it—including mine!
Verify these results for yourself without having to take anyone’s word for it—including mine! ![]()
The Astronomical Ice Age Theory
There is strong geological evidence for a past Ice Age, which creation scientists attribute to the aftermath of the Genesis Flood.2 Secular scientists, however, claim that many ice ages have occurred within the last few million years of “prehistory.” Supposedly, ice ages are paced by seasonal and latitudinal variations in the sunlight falling on Earth. These variations in sunlight are thought to be caused by slow changes in Earth’s orbital and rotational motions. Many scientists believe this astronomical (or Milankovitch) theory to be correct because of a 1976 paper titled “Variations in the Earth’s Orbit: Pacemaker of the Ice Ages.”3 (As you read this article, you might find it helpful to have a copy of the Pacemaker paper in front of you.4)
Some background information is necessary to see why the Pacemaker results are invalid.
There is strong geological evidence for a past Ice Age. ![]()
Wave Basics
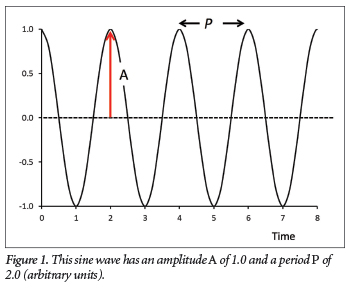 A sine function is a repeating wave-like mathematical function that can vary in time or space or both. A complete wave cycle is defined by two consecutive peaks. The time corresponding to one complete peak-to-peak wave cycle is called the period.
One can calculate the period P by dividing the total time T the wave was observed by the number of wave cycles N that occurred during that time:
P = T/N (1)
In Figure 1, four horizontal peak-to-peak cycles occur within a measured time of 8.0 seconds. Thus, the period for this sine function is P = (T ÷ N) = (8.0 s ÷ 4) = 2.0 seconds. We can rearrange Equation (1) to give us an expression for the number of cycles, N:
N = T/P (2)
Another important wave property is the wave’s amplitude, half the vertical peak-to-trough distance. The amplitude A of the wave in Figure 1 is 1.0.
Superposition
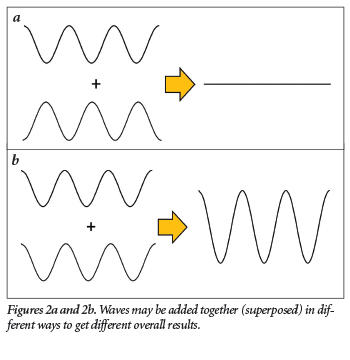 Waves can be added (or superposed) together. For instance, one can add two sine functions together with the same periods and amplitudes so that the peaks of one wave align precisely with the troughs of the other wave. In that case, the wave features completely cancel out, resulting in a flat line (Figure 2a). One could also add those same two waves together so that the peaks of one wave align precisely with the peaks of the other wave. In that case, the resulting wave will retain the original period but have twice the amplitude of the individual waves (Figure 2b).
One can also add waves in more complicated ways. For instance, the wiggly pattern at the bottom of Figure 3 was obtained by adding together the three sine waves shown in the figure. A technique called spectral analysis enables scientists to “reverse engineer” the amplitudes and periods of the waves that were added together to obtain the resultant wiggly pattern.
Deep-Sea Cores and Oxygen Isotope Values
 The Pacemaker authors analyzed data from two southern Indian Ocean deep-sea cores, designated as RC11-120 and E49-18. They calculated a quantity called the oxygen isotope ratio, indicated by the shorthand notation δ18O. High δ18O values within the sediments are thought to indicate that the sediments were deposited during ice ages, and sediments having low δ18O values are thought to have been deposited during warmer periods. Secular scientists also recorded other values within the sediments thought to have climate significance: inferred sea surface temperatures (SST) and the percentage abundance of a microscopic organism called Cycladophora davisiana. Secular scientists believed that these three quantities within the sediments told a story about prehistoric climate change.
If one plots the δ18O, SST values, or the percentage abundances of C. davisiana within a core as a function of depth (or time), the result is a wiggly pattern similar to that shown at the bottom of Figure 3. However, these wiggly patterns are generally more complicated than the one in Figure 3, so it is often necessary to add together dozens of sine waves to produce these patterns.
Constructing the Timescales
Before performing their spectral analysis, the Pacemaker scientists used uniformitarian assumptions to assign ages to the seafloor sediments. How they did so will be explained in part two of this series, but critical to the construction of their timescales was their assumed age of 700,000 years for the most recent “flip” or reversal of the earth’s magnetic field.3,5 After using this age to help set up their age models for the two cores, they assigned a total time of 273,000 years (273 ka) to the shorter RC11-120 core and 363,000 years (363 ka) to the longer E49-18 core.6 They used a similar method to assign a total time of 486,000 years (486 ka) to the PATCH “core” that they constructed by combining segments of data from the two cores.7
Evidence for the Astronomical Theory?
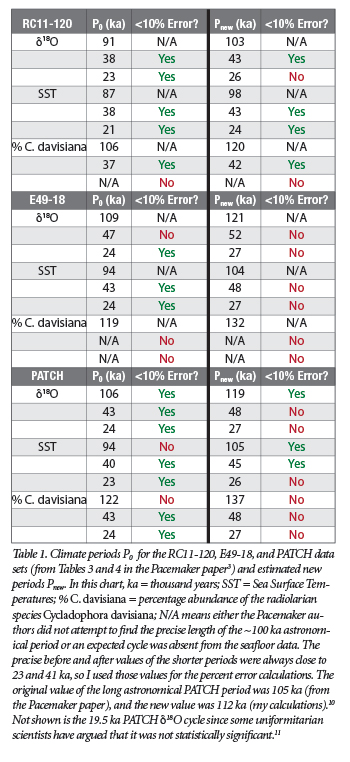 Spectral analysis showed that of the dozens of waves added together to produce the δ18O, SST, and percentage C. davisiana wiggly patterns, the waves having the largest amplitudes had periods close to 100, 41, and 23 ka, the periods calculated from Earth’s orbital and rotational motions (see the second column in Table 1). This was seen as strong evidence for an astronomical influence on climate.
For instance, Table 1 shows that the largest amplitude δ18O waves in the RC11-120 core had periods of 91, 38, and 23 ka. Likewise, the largest amplitude δ18O waves in the E49-18 core had periods of 109, 47, and 24 ka. The PATCH δ18O data seemed to show cycles of 106, 43, 24, and 19.5 ka. They found similar results for the other two variables measured in the seafloor sediments.
It is not necessary to understand the mathematical details of spectral analysis to make a devastating case against the Pacemaker paper. Instead, for the sake of argument, we will simply accept their reported results at face value and then show that uniformitarian scientists have themselves since invalidated these results!8
Finding the Number of Cycles
For each of the large-amplitude waves listed in the Pacemaker paper’s Tables 3 and 4,3 we can use Equation (2) to find the number of associated wave cycles. For the first δ18O wave from the E49-18 core, we obtain N1 = (363,000 years ÷ 109,000 years per cycle) = 3.33 cycles. For the second E49-18 δ18O wave, we obtain N2= (363,000 years ÷ 47,000 years per cycle) = 7.72 cycles, and for the third E49-18 δ18O wave, we find N3 = (363,000 years ÷ 24,000 years per cycle) = 15.13 cycles. Similar calculations give the numbers of prominent wave cycles for the other two climate variables within the cores.
A Problematic Age Revision
But over 25 years ago—more than a decade after the Pacemaker paper’s publication—secular scientists changed their age estimate for the magnetic reversal on which the calculations were based to 780,000 years.9 Using the Pacemaker authors’ own method (which will be explained in part two), this revision changes the times assigned to cores. The new total times assigned to the RC11-120, E49-18, and PATCH data sets are 309,000, 403,000 years, and 544,000 years, respectively. What effect do these changes have on the original results?
Finding the New Periods
Figure 3 illustrates an important point: the value assigned to the time T in Figure 3 does not change the shape of the resultant wiggly pattern. Regardless of whether one claims that T equals 8.0 seconds or 800,000 years, the wiggly pattern looks exactly the same. And because the resulting pattern looks the same, so do the sine waves that were added together to obtain that pattern. And this means the number of wave cycles N for each sine wave will remain the same regardless of what value is assigned to T. For instance, Wave 2 in Figure 3 exhibits a little more than four wave cycles, and Wave 3 exhibits a little more than three wave cycles, no matter what number we assign to T.
Because of the way the Pacemaker scientists assigned ages to the seafloor sediments, the new timescales caused little change to the shapes of the wiggly patterns from the sediment cores. And this means that the shapes of the individual sine waves were not changed much either. For instance, changing the total time assigned to the E49-18 core from 363,000 years to 403,000 years does not significantly change the number of cycles exhibited by each of the three large-amplitude waves. But now those same numbers of cycles must fit into a total time of 403,000 years instead of the original 363,000 years. So, dividing 403,000 years by 3.33, 7.72, and 15.13 gives new climate periods of 121, 52, and 27 thousand years. The last two values are especially in poor agreement with the values of 41 and 23 thousand years expected from the Milankovitch theory.1,10
The age revision has dramatically weakened their argument for an astronomical influence on climate! ![]()
In the Pacemaker paper, the calculated periods were almost always within 10% of the astronomically calculated values (the first three columns in Table 1). But this is no longer the case with the new calculations, as shown in the last two columns of the table. The age revision—made by uniformitarian scientists themselves—has dramatically weakened their argument for an astronomical influence on climate!
This method is not perfect since there are complications that affect the results slightly, but it gives a very good estimate of what the Pacemaker results would have been had the authors used in their calculations the currently accepted age of 780 ka for the most recent magnetic reversal rather than their previous age of 700 ka.1
That’s it—that’s all you have to do to verify that these iconic results are wrong. We will tie up the loose ends of this argument in part two of this series by explaining how the Pacemaker scientists assigned their ages to the Indian Ocean sediment cores. We will also briefly discuss the implications, and they are quite significant, of these results for both the creation-evolution controversy and the debate over climate change.
Click here to read “Testing Old-Earth Climate Claims, Part 2.”
References
- Hebert, J. 2017. A Broken Climate Pacemaker? – Part 1. Journal of Creation. 31(1): 88-98.
- Hebert, J. 2013. Was There An Ice Age? Acts & Facts. 42 (12): 20.
- Hays, J. D., J. Imbrie, and N. J. Shackleton. 1976. Variations in the Earth’s Orbit: Pacemaker of the Ice Ages. Science. 194 (4270): 1121-1132.
- Click here for an online copy of the Pacemaker paper.
- Shackleton, N. J. and N. D. Opdyke. 1973. Oxygen Isotope and Palaeomagnetic Stratigraphy of Equatorial Pacific Core V28-238: Oxygen Isotope Temperatures and Ice Volumes on a 105 Year and 106 Year Scale. Quaternary Research. 3 (1): 39-55.
- Their Table 3 implies this time is 362 ka, but because of the way the scientists did their analysis, all the values of T in the Pacemaker paper had to be evenly divisible by 3. Therefore, the correct total time is 363 ka.
- Their Table 4 reports this time as 468 ka, but they transposed the 6 and 8. Again, all values of T had to be evenly divisible by 3.
- However, I can vouch that their original results are generally correct since I replicated them. See Hebert, J. 2016. Revisiting an Iconic Argument for Milankovitch Climate Forcing: Should the “Pacemaker of the Ice Ages” Paper Be Retracted? Part 2. Answers Research Journal. 9: 131-147.
- Shackleton, N. J., A. Berger, and W. R. Peltier. 1990. An Alternative Astronomical Calibration of the Lower Pleistocene Timescale Based on ODP Site 677. Transactions of the Royal Society of Edinburgh: Earth Sciences. 81 (4): 251-261.
- Hebert, J. 2016. Revisiting an Iconic Argument for Milankovitch Climate Forcing: Should the “Pacemaker of the Ice Ages” Paper Be Retracted? Part 3. Answers Research Journal. 9: 229-255.
- Muller, R. A. and G. J. MacDonald. 2000. Ice Ages and Astronomical Causes: Data, Spectral Analysis, and Mechanisms. Chichester, UK: Praxis Publishing, 74-78.
* Dr. Hebert is Research Associate at the Institute for Creation Research and earned his Ph.D. in physics from the University of Texas at Dallas.