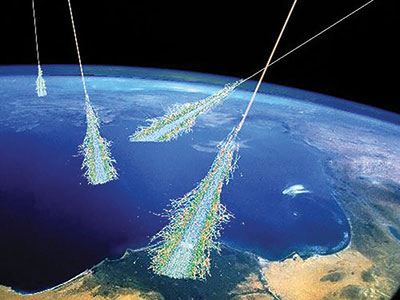
 Last month’s article described two possible mechanisms by which the sun could affect Earth’s weather and climate.1 Both mechanisms use the fact that the sun’s magnetic field greatly influences the number of fast-moving charged particles (mainly protons) called galactic cosmic rays (GCRs) that enter Earth’s atmosphere. A shower of charged particles, or ions, is produced when these cosmic rays collide with molecules in the atmosphere (Figure 1).
The first mechanism, advocated by Dr. Henrik Svensmark, holds that the ions resulting from GCRs increase the kinds of aerosols needed to form water droplets in clouds, with more aerosols enabling more clouds to form.2 The second was formulated by University of Texas Dallas professor emeritus Dr. Brian Tinsley, who was my Ph.D. advisor.3 In his proposed mechanism, cosmic rays are one of several factors influencing a downward fair-weather current density. This current density affects the rates at which aerosols are scavenged by cloud droplets. This in turn influences the sizes of cloud droplets, which ultimately affect cloud behavior.
Dr. Tinsley’s mechanism is more likely to be the true connection between the sun, cosmic rays, and Earth’s weather and climate. This mechanism explains a wide array of observations not explained by Svensmark’s alternate model.4
An Overview
One layer in Earth’s atmosphere, the ionosphere, is a very good conductor of electricity. Earth’s surface is also a good conductor. Thunderstorms in the low latitudes act as “batteries” that continuously deposit positive electrical charge on the ionosphere. Because of this charge, there is a large potential difference, or voltage, between the ionosphere and Earth’s surface. This voltage is about 250,000 volts, although it can be higher or lower depending on the number of thunderstorms going on at any given time.
The atmosphere below the ionosphere is not a good electrical conductor. Ions are present in the lower atmosphere, though not nearly as many as are in the ionosphere. These ions allow the lower atmosphere to conduct electricity, but only weakly.
Because the atmosphere is weakly conducting, this 250,000-volt potential difference drives a downward current of about 1,000 amperes. This electrical current is not lightning. Rather, it’s a “fair weather” electrical current that falls over the entire surface of the earth. The amount of current striking one square meter of ground is very, very tiny, only a few trillionths of an ampere per square meter.
Physicists often use J to symbolize electrical current density and z to represent the downward direction. For this reason, they use Jz to represent this downward fair-weather current density.
Current Density Jz and Clouds
Clouds are even poorer conductors of electricity than the surrounding air. Physics shows that Jz passing through a cloud will cause a layer of positive charge to form on the cloud top and a layer of negative charge to form on the cloud bottom. This charge attaches to water droplets in the cloud as well as to tiny particles called aerosols. Some of these aerosols, called cloud condensation nuclei (CCNs), have the right properties to act as “seeds” for the formation of new cloud droplets.
Computer simulations show that this charge increases the rates at which the cloud droplets scavenge, or “gobble up,” the larger CCNs. It also decreases the rates at which the smaller CCNs are scavenged.5 In other words, the presence of this charge influences, or modulates, the rates at which aerosols are scavenged by cloud droplets. For this reason, the effect is called charge modulation of aerosol scavenging (CMAS).
As the previous article explained, this tends to make cloud droplets more uniform in size. This greater uniformity reduces the likelihood of rainfall, which means the cloud will last longer. So, increases in Jz should increase cloud cover, and decreases in Jz should decrease cloud cover.
Factors Affecting Jz
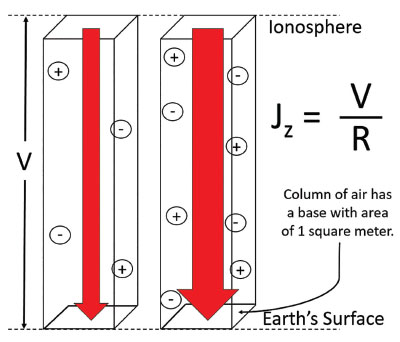
You may remember the equation V = I × R from physics class. This equation can be rearranged as I = V/R. In other words, the current I passing through an object depends on the voltage V across the object and the object’s electrical resistance R. So, changes in V and/or R can change the current I.
The situation with the fair-weather current density Jz is very similar. Jz is the current through a column of air with a base one square meter in area. At a given location, Jz depends on the voltage V between Earth’s surface and the ionosphere, as well as the resistance R of the air column at that location. At any given time, the voltage V will be the same at most locations above Earth’s surface.
However, V varies with time due to changes in worldwide thunderstorm activity. The resistance R of the air column depends on local air pollution and the local number of ions in the atmosphere.
Because these factors vary from place to place, R also varies from place to place. Heavy air pollution can cause a column of air at one location to conduct electricity poorly so that the air column has a higher electrical resistance R. Likewise, low levels of pollution and a large number of ions can make the resistance R of the air column lower, allowing the air column to conduct electricity more easily. This causes the size of the current density Jz to vary from place to place even though the same voltage V is “pushing” the two current densities (Figure 2).
CMAS Predictions
If the CMAS mechanism is valid, cloud cover at a particular location will quickly increase when Jz at that location increases. Likewise, cloud cover will quickly decrease when Jz decreases.
Local cloud cover will also increase during increases in V that are large enough to increase Jz even though R may be getting a little smaller. Local cloud cover will also increase when the local columnar resistance R greatly decreases. This would happen when many more cosmic rays enter the atmosphere at times of solar minimum (low sunspot activity). During those times, decreases in R can be so large that Jz also increases even though V might decrease somewhat.
Cyclone Intensification
A Forbush decrease is a drop in the number of cosmic rays entering the atmosphere. A Forbush decrease occurs when a blob of plasma from a coronal mass ejection reaches Earth. Winter cyclones in the northern high latitudes become less intense about a day after a moderate or large Forbush decrease.6
Tinsley concluded the decreased number of cosmic rays during a Forbush decrease was causing Jz to become smaller. So, if smaller Jz values are weakening cyclones, then it seems reasonable that increases in Jz should strengthen cyclones.
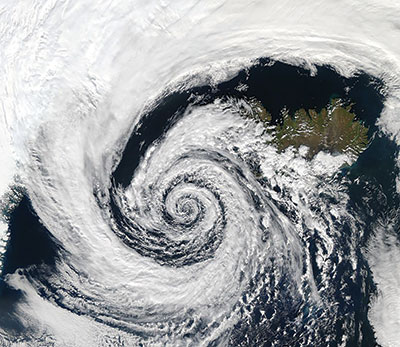
Here’s why. Remember that higher values of Jz cause larger aerosols to be scavenged more frequently by cloud water droplets. A class of larger aerosols called ice-forming nuclei (IFN) form ice when they come into contact with supercool water droplets, such as those found in clouds. So, at times of higher Jz, more IFNs are scavenged by water droplets, making more ice. Energy in the form of latent heat is given off when ice forms. This heat warms the air, causing it to rise. Air from lower elevations then moves inward to replace this upward-moving air. As a greater mass of air moves toward the center of the cyclone, the cyclone spins faster, just as a figure skater spins faster when she pulls in her arms and legs. In this way, higher values of Jz can make cyclones spin faster and become more intense.
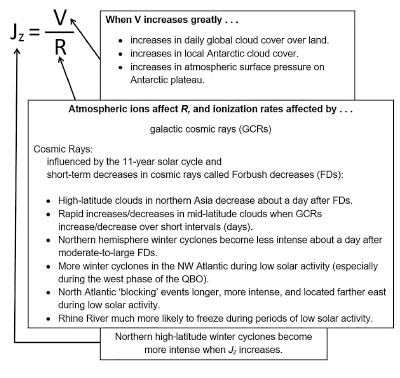
My Ph.D. research used Jz data measured at Hawaii’s Mauna Loa Observatory from 1960–61 and 1976–84.7 As Tinsley’s model predicted, I found evidence that higher values of Jz do indeed cause winter cyclones to become more intense (Figure 3). The effect was subtle, but it showed up in two independent data sets.8-10
Direct and indirect evidence for the CMAS mechanism are summarized in Figure 4. There are additional lines of evidence, but they are difficult to explain in a short article.11-14
A Connection to the Little Ice Age?
Cyclones are low-pressure weather systems. An area called the Icelandic Low is a major source of cyclones in the North Atlantic. When cyclones become more intense, high-pressure systems located “downstream” (to the east) of these cyclones also become more intense.15 These high-pressure systems can block the flow of warm moist air from the Atlantic Ocean onto the European continent. If these blocking events last for significant amounts of time, they can cause especially cold European winters.
North Atlantic blocking events last longer, are more intense, and are located farther east during periods of low solar activity.16 Tinsley thinks higher Jz values during very low solar activity were the ultimate cause of the very cold winters during the Maunder Minimum, the coldest part of the Little Ice Age. During the Maunder Minimum (lasting from around 1645 to 1715), more cosmic rays entered the atmosphere, especially at higher latitudes.17 This greatly increased the number of ions in the atmosphere, resulting in higher Jz values that caused North Atlantic winter cyclones to spin faster and become more intense. This was accompanied by longer and more intense blocking events to the east, and these prevented warm, moist Atlantic air from flowing onto Europe, resulting in the very cold European winters of the Maunder Minimum.
Experts expect the current solar minimum to be the weakest of the last 200 years.18 If Tinsley is right, European winters should be especially severe during that time.19
Implications for Global Warming
The predictions of computer climate models are one of the main arguments for catastrophic global warming. Yet, these computer models are relatively crude. There is much about the weather and climate that scientists don’t yet fully understand.20 Scientists on both sides of the debate acknowledge that clouds are a major climate “wild card” since they could enhance or impede any potential warming.21
It appears the ability of the sun’s magnetic field to allow or block cosmic rays is an important factor in Earth’s weather and climate. Research like this can help us better understand factors influencing cloud behavior. This has the potential to add more light (and less heat!) to the global warming debate.
If you want to learn more about this subject, the four in-depth technical articles cited in references 11-14 are archived at ICR.org/jake_hebert.
Click here for Cosmic Rays, Sunspots, and Climate Change, Part 1.
References
- Hebert, J. 2020. Cosmic Rays, Sunspots, and Climate Change, Part 1. Acts & Facts. 49 (3): 10-13.
- Vardiman, L. 2008. A New Theory of Climate Change. Acts & Facts. 37 (11): 10-12.
- Tinsley, B. A., G. B. Burns, and L. Zhou. 2007. The role of the global electric circuit in solar and internal forcing of clouds and climate. Advances in Space Research. 40 (7): 1126-1139.
- I should point out that Dr. Tinsley’s views differ from mine when it comes to hot button topics like creation and global warming.
- Tinsley, B. A. 2010. Electric charge modulation of aerosol scavenging in clouds: Rate coefficients with Monte Carlo simulation of diffusion. Journal of Geophysical Research. 115: D23211.
- Tinsley, B. A. and G. W. Deen. 1991. Apparent Tropospheric Response to MeV-GeV Particle Flux Variations: A Connection Via Electrofreezing of Supercooled Water in High-Level Clouds? Journal of Geophysical Research. 96 (D12): 22283-22296.
- Hebert, L. 2011. Atmospheric Electricity Data from Mauna Loa Observatory: Additional Support for a Global Electric Circuit-Weather Connection? Ph.D. dissertation, University of Texas at Dallas.
- Hebert, L., III, B. A. Tinsley, and L. Zhou. 2012. Global electric circuit modulation of winter cyclone vorticity in the northern high latitudes. Advances in Space Research. 50 (6): 806-818.
- I also found preliminary evidence for this effect in a third data set. That was about the time I began working for ICR, so I was unable to do a more thorough and formal analysis of that third data set. However, all three results were shared at a poster session of the 2011 American Geophysical Union meeting in San Francisco. See also reference 10.
- Hebert, L., B. A. Tinsley, and L. Zhou. 2011. Is the global electric circuit modulating winter cyclone vorticity in the northern high latitudes? American Geophysical Union, Fall Meeting 2011, Abstract ID AE31A-0255.
- Hebert, J. 2013. Two possible mechanisms linking cosmic rays to weather and climate. Journal of Creation. 27 (2): 91-98.
- Hebert, J. 2013. Apparent difficulties with a CMAS cosmic ray-weather/climate link. Journal of Creation. 27 (3): 93-97.
- Hebert, J. 2014. Are cosmic rays affecting high-latitude winter cyclones? Journal of Creation. 28 (1): 59-67.
- Hebert, J. 2014. Solar activity, cold European winters, and the Little Ice Age. Journal of Creation. 28 (1): 114-121.
- Lupo, A. R. and P. J. Smith. 1995. Climatological features of blocking anticyclones in the Northern Hemisphere. Tellus. 47 (4): 439-456.
- Barriopedro, D., R. Garcia-Herrera, and R. Huth. 2008. Solar modulation of Northern Hemisphere winter blocking. Journal of Geophysical Research. 113: D14118.
- One expects this effect to be greatest at higher latitudes, where percentage changes in cosmic rays over a solar cycle are the greatest.
- Tabor, A., ed. Solar Activity Forecast for Next Decade Favorable for Exploration. NASA. Posted on nasa.gov June 12, 2019, accessed February 5, 2020.
- The effect seems most pronounced when a quasi-periodic variation in equatorial stratospheric winds, the “quasi-biennial oscillation,” is in its westerly phase.
- Spencer, R. W. New Lewis & Curry Study Concludes Climate Sensitivity is Low. Posted on drroyspencer.com April 24, 2018, accessed October 17, 2018.
- Boucher, O. et al. 2013. Clouds and Aerosols. In Climate Change 2013: The Physical Science Basis. Contribution of Working Group I to the Fifth Assessment Report of the Intergovernmental Panel on Climate Change. T. F. Stocker et al, eds. New York: Cambridge University Press, 571-657.
* Dr. Hebert is Research Associate at the Institute for Creation Research and earned his Ph.D. in physics from the University of Texas at Dallas.


