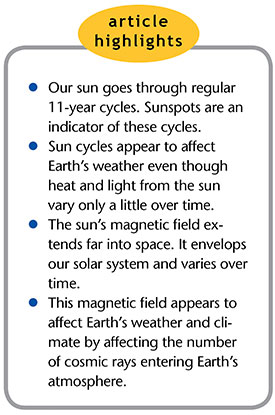
 Sunspots are relatively cool blotches on the sun’s surface (Figure 1). The number of sunspots is an indicator of how active the sun is. It has the most sunspots when it’s most active—at solar maximum—and has a slightly higher total energy output during that time. Likewise, the sun has the fewest sunspots at solar minimum. The number of sunspots varies over an 11-year solar cycle. Could there be a connection between sunspot cycles and Earth’s weather and climate? If so, is this relevant to the global warming debate?
Sunspots and the Little Ice Age
We are now close to a solar minimum, with few observable sunspots. Scientists have predicted that within the next 30 years an even deeper solar minimum, with even fewer sunspots, could occur.1 Such a time of extremely low solar activity is called a grand solar minimum.
The last grand solar minimum was the Maunder Minimum (Figure 2), named after British astronomer Edward W. Maunder. It lasted from 1645 to 1715 and coincided with the coldest part of the period known as the Little Ice Age. There is debate about whether the Little Ice Age was a time of globally lower temperatures or whether they were only lower in certain regions. However, it’s widely accepted that temperatures in Europe and North America were much colder during the Maunder Minimum. In fact, winters in Britain were so cold that the Thames River sometimes froze over, allowing Londoners to have “frost fairs” on the ice!
The Sun and Climate
Much circumstantial evidence suggests that the sun somehow affects Earth’s weather and climate.2-5 However, any connection between the sun and weather has to be due to something other than changes in the sun’s overall brightness, since it changes only a tiny amount (0.1%) over an 11-year solar cycle.6
The sun’s magnetic field, however, varies considerably over both long and short time periods, and sunspots are highly magnetized. Part of the sun’s magnetic field extends far out into space, even to the planets. This part of the field is called the interplanetary magnetic field (IMF). The IMF influences the number of fast-moving charged particles from outer space entering Earth’s atmosphere. These particles (mainly protons) are called galactic cosmic rays (GCRs)7 and are thought to come from supernova explosions and other distant sources within our Milky Way galaxy.
During a solar minimum, the IMF is weaker and allows many GCRs to enter Earth’s atmosphere. At solar maximum, the opposite is true—the IMF is stronger and greatly decreases the number.8 The number of cosmic rays entering the atmosphere can vary 15% over the course of a solar cycle.9
When these fast-moving protons collide with molecules in our atmosphere, a shower of charged particles, or ions, is produced. Many scientists suspect these charged particles influence cloud behavior, which affects global weather and climate.
The First Model on the Effect of GCRs
There are two main schools of thought on how GCRs could affect weather and climate. Danish physicist Dr. Henrik Svensmark advocates the first proposal.10 Cloud droplets cannot form unless tiny particles, or droplets, called aerosols are present in the air. Some of these aerosols have the right properties to act as “seeds” for the formation of new water droplets in clouds. These aerosols are called cloud condensation nuclei (CCNs) because water vapor condenses on them to form cloud droplets. The charged particles (ions) that result when GCRs enter the atmosphere increase the number of CCNs, enabling more cloud droplets to form. This model can be summarized as “more cosmic rays make more clouds.”
The Second Model on the Effect of GCRs
Dr. Brian Tinsley, professor emeritus of the University of Texas at Dallas (UTD), endorses the second model.11 In my opinion, Dr. Tinsley’s mechanism is more convincing than Dr. Svensmark’s, although I am admittedly biased since Dr. Tinsley was my Ph.D. research advisor at UTD.12 I should point out that Dr. Tinsley doesn’t share my creationist views, and he believes global warming is real, although he doesn’t think we should panic over it.
Dr. Tinsley’s mechanism involves the fact that Earth’s surface and ionosphere (a highly conducting layer of the atmosphere above the atmosphere’s lower layers) are good conductors of electricity. Electrical capacitors are made of two electrical conductors (usually metals) separated by a short distance. When the two metals are connected to opposite terminals of a battery, equal and opposite charges are stored on them.
Many of us were introduced in physics class to capacitors composed of two parallel metal plates. Although Earth and the ionosphere are both spherical, physicists simplify the analysis by treating the ionosphere as one plate and Earth’s surface as the other plate of a parallel plate capacitor.
The Global Electric Circuit
Low-latitude thunderstorms act like batteries that maintain a potential difference, or voltage,13 of about 250,000 volts between the ionosphere and the ground. This voltage can vary depending on the amount of worldwide thunderstorm activity.
On a well-designed capacitor, the charges on the metal plates are maintained as long as the battery remains connected. However, if a material is placed between the metal conductors that weakly conducts electricity, a small current will flow from one metal plate to the other. The charged particles (ions) in Earth’s lower atmosphere make the air a weak electrical conductor. The 250,000-volt potential difference between the ionosphere and Earth’s surface drives a total current of about 1,000 amperes toward the ground. However, this current is spread over Earth’s entire surface so that the current falling on a given square meter of surface is tiny—just a few trillionths of an ampere.
This tiny current density (current per square meter) can be measured with sensitive instruments. Physicists often use the letter J to denote electrical current and the letter z to indicate the vertical direction, so this downward fair-weather current density is indicated by the symbol Jz. This current per square meter is not lightning—it’s the downward electrical current (per square meter) that comes from the ionosphere to Earth’s surface.
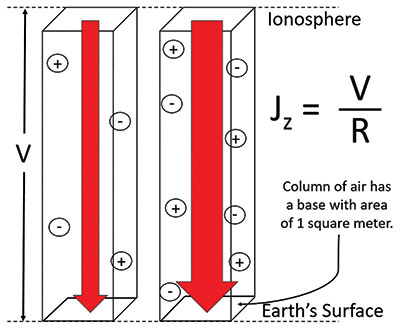
For most locations on Earth’s surface, the voltage V will have the same value at any given time. But the electrical resistance R of a particular column of air varies with location because it depends on the number of ions in the air at that location. The more ions, the easier the currents can flow and the greater Jz will be. Therefore Jz varies from place to place. At one location Jz can be high while simultaneously being lower at some other location even though the same voltage V is “pushing” both current densities (Figure 3).
Charges on Clouds
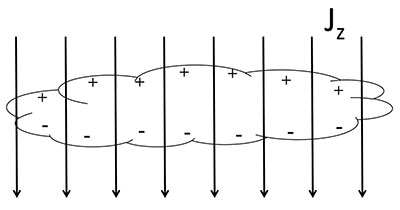
Physics theory shows that when Jz passes through a cloud, a layer of positive charge forms on the cloud top and a layer of negative charge forms on the cloud bottom (Figure 4). The amount of this charge depends on Jz; the higher the current density Jz, the greater the charge. This charge ends up on both CCNs and water droplets within the cloud.
When CCNs and water droplets collide, they almost always stick together.13 However, the charges on the CCNs and water droplets influence the rates at which the tiny CCNs are scavenged or “gobbled up” by the larger droplets.
At first, you might think the charges simply repel the droplets from the CCNs since like charges repel. But it’s more complicated than that. The water droplets and CCNs are more like little conducting spheres than the “point” charges you may have discussed in high school or college physics classes. This means there will be both attractive and repulsive forces between the CCNs and cloud droplets.
Sophisticated computer simulations show these charges increase the rates at which large CCNs are scavenged by the water droplets while at the same time decreasing the rates at which smaller CCNs are scavenged.15 In the Tinsley model, the charges on cloud droplets and aerosols influence or modulate the rate at which aerosols are scavenged by water droplets. For this reason, it is called charge modulation of aerosol scavenging (CMAS).15
The Effect on Clouds
As Jz grows, more of the large CCNs will be scavenged by the existing water droplets. This means the remaining CCNs, which can still act as potential “seeds” for the formation of new droplets, will be smaller on average. Smaller CCNs favor the formation of smaller water droplets. So, when Jz is high, newly forming cloud droplets should be smaller on average. This makes the range in droplet sizes within the cloud smaller so that the droplets are more uniform in size. Because rain occurs when larger cloud droplets collide and coalesce with smaller cloud droplets, more homogenous droplets delay rainfall. That means the cloud will last longer.
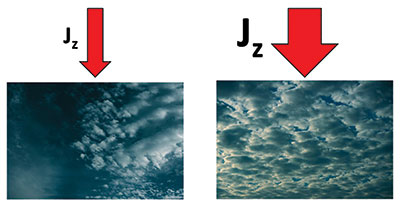
One big prediction of Dr. Tinsley’s model is that at locations where Jz is high, clouds will have smaller average droplet sizes, will last longer, and will delay dropping rainfall. Likewise, lower values of Jz will be associated with larger droplet sizes, fewer clouds, and shorter cloud lifetimes (Figure 5).
The Cosmic Ray Connection
You may remember the equation V = IR from physics class. Here, V is the voltage applied across an object having an electrical resistance R, and I is the resulting electrical current that the voltage is pushing through the object. The equation can be rearranged as I = V/R.
The current I depends on both voltage and resistance. The same is true with the current density Jz. Its value at a given location depends on the electrical resistance R of the atmosphere at that location.16 This is because columns of air with high electrical resistances have low electrical conductivities and vice versa. Jz also depends on the voltage V between the ionosphere and Earth’s surface. For this reason, Jz can vary in size from place to place. At one location Jz can be high, but at the same time it can be smaller at another location.
Dr. Tinsley thinks Jz is the true connection between solar activity, cosmic rays, and weather and climate. He thinks others have mistakenly focused entirely on cosmic rays when they are really just one of a number of factors that influence Jz. For this reason, he thinks researchers should look for correlations between weather, climate, and Jz—not simply between weather, climate, and cosmic rays.
In Part 2, we discuss evidence for this mechanism, ways to test its validity, and its possible implications for the global warming debate.
Click here for Cosmic Rays, Sunspots, and Climate Change, Part 2.
References
- Zharkova, V. V. et al. 2019. Oscillations of the baseline of solar magnetic field and solar irradiance on a millennial timescale. Scientific Reports. 9: 9197.
- Hebert, J. 2013. Two possible mechanisms linking cosmic rays to weather and climate. Journal of Creation. 27 (2): 91-98.
- Hebert, J. 2013. Apparent difficulties with a CMAS cosmic ray–weather/climate link. Journal of Creation. 27 (3): 93-97.
- Hebert, J. 2014. Are cosmic rays affecting high-latitude winter cyclones? Journal of Creation. 28 (1): 59-67.
- Hebert, J. 2014. Solar activity, cold European winters, and the Little Ice Age. Journal of Creation. 28 (1): 114-121.
- Hargreaves, J. K. 1992. The Solar-Terrestrial Environment. Cambridge, UK: Cambridge University Press, 141.
- Here, the term “cosmic rays” is misleading because these are actually charged particles rather than rays.
- This is because magnetic fields can deflect moving charged particles.
- Carslaw, K. S., R. G. Harrison, and J. Kirkby. 2002. Cosmic Rays, Clouds, and Climate. Science. 298 (5599): 1732-1737.
- Vardiman, L. 2008. A New Theory of Climate Change. Acts & Facts. 37 (11): 10.
- Tinsley, B. A., G. B. Burns, and L. Zhou. 2007. The role of the global electric circuit in solar and internal forcing of clouds and climate. Advances in Space Research. 40 (7): 1126-1139.
- Hebert, L. 2011. Atmospheric Electricity Data from Mauna Loa Observatory: Additional Support for a Global Electric Circuit-Weather Connection? Ph.D. dissertation, University of Texas at Dallas.
- Voltage, or potential difference, can push electrical charge from one place to another. Voltage (measured in volts) can be compared to a pressure difference. Just as a pressure difference between two locations can push water from one place to another, a potential difference (or voltage) can push electrical charge from one place to another.
- Rogers, R. R. and M. K. Yau. 1996. A Short Course in Cloud Physics, 3rd ed. Oxford, UK: Butterworth-Heinemann, 124.
- Tinsley, B. A. 2010. Electric charge modulation of aerosol scavenging in clouds: Rate coefficients with Monte Carlo simulation of diffusion. Journal of Geophysical Research. 115 (D23): 211.
- Technically, R is the columnar resistance—the total electrical resistance of a column of air whose base has an area of one square meter. Columnar resistance has units of ohms-m2 rather than ohms.
* Dr. Jake Hebert is Research Associate at the Institute for Creation Research and earned his Ph.D. in physics from the University of Texas at Dallas.


