Introduction
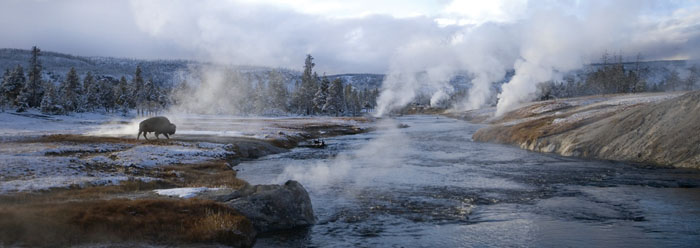
Yellowstone National Park holds the distinction of being the first national park in the United States and in the world. It exhibits magnificent geological features such as a 30-mile-diameter volcanic caldera; myriads of geysers, including Old Faithful; and a major community of large animals such as deer, elk, moose, and bear.
What many visitors to Yellowstone do not realize, however, is that it also contains latent evidence of massive amounts of ice that filled the basin of Yellowstone Lake to a depth of over 3,000 feet, and glaciers that flowed from the high elevations in the park northward into Montana along the Yellowstone River and southward into the Snake River at the foot of the Tetons. These glaciers are conventionally thought to have been present hundreds of thousands of years ago during several ice ages, the last of which reached its peak about 18,000 years ago. However, if one accepts the literal biblical chronology that the age of the earth is only six to ten thousand years old, how is it possible for ice to have filled the basins and valleys of Yellowstone in such a short time?
I reported in an earlier issue of Acts & Facts about numerical simulations of glacier growth in Yosemite National Park from a storm called the Pineapple Express.1 The storm picked up moisture from warm seasurface temperatures in the Pacific Ocean after the Genesis Flood and doubled or quadrupled the precipitation in the park at warmer seasurface temperatures. Enhanced snowfall and greater frequency of storms during the Ice Age explained the glaciation in the Sierra Nevada from a young-earth perspective. Glaciers thousands of feet thick would have readily developed in hundreds of years following the Flood.
Wesley Brewer and I completed additional simulations for other storms in Yosemite National Park that confirmed the original findings.2, 3 We found that the major type of storm that appears to have contributed the most to the glaciations during the Ice Age was a deep upper-low type of storm. We then proceeded to conduct simulations on three other storms for Yellowstone National Park.4 The reason for conducting similar studies in Yellowstone was to determine if warm sea-surface temperatures in the Pacific Ocean would also cause glaciation in mountains farther north and inland from the coast.
The basic mechanism that was proposed to form glaciers in short periods of time was a warm ocean heated by the events of the Genesis Flood.5 Geologic work done during the Flood is believed to have transferred heat from magma in the mid-ocean ridges on the sea floor to the ocean. A warm ocean would have produced a giant “El Niño” effect—increased evaporation over the ocean and more transport of moisture over land to be condensed as precipitation on the mountains. The case studies done in Yosemite and Yellowstone National Parks confirmed this theory.
The Continuous Zonal Flow Storm
Of the three types of storms simulated in Yellowstone National Park, the type that moves rapidly from west to east across the Northwest and the northern Rocky Mountains was found to be the primary contributor to glacier growth. It is common for the polar jet stream to move southward from Canada and strengthen during winter, producing a series of rapidly moving, small-amplitude waves in the jet stream with associated surface storms that move from the Pacific Ocean across the North American continent.
During the Ice Age, the jet stream is thought to have been located across central California.6 Each storm moving with the waves in the jet stream typically lasted about 24 hours in a given location and precipitated a moderate amount of rain or snow. However, the cumulative effect of many such storms augmented with moisture from a warm ocean can rapidly grow glaciers at high elevations in Yellowstone National Park. Other types of storms such as the Gulf of Alaska low and the plunging western low can produce more precipitation during each storm and can last longer, but their frequencies are typically much less.
A ten-day series of zonal flow storms during the Christmas holidays of 2005-2006 was simulated with the National Center for Atmospheric Research’s mesoscale Weather Research and Forecasting (WRF) model.7 The storm period was validated using observed sea-surface temperatures (SST) in the Pacific Ocean. Then the sea-surface temperature was artificially set in the model to six prescribed temperatures between 32°F and 113°F to determine the effects of a warm ocean.
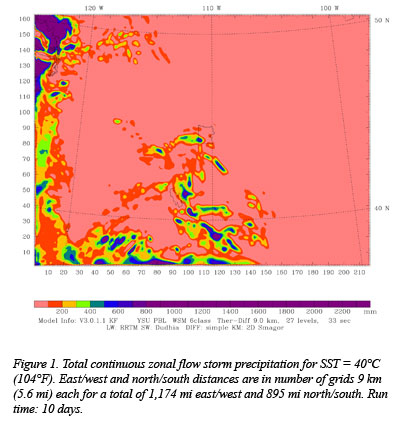 Figure 1 shows an example of the total accumulated precipitation in millimeters over the ten-day period for a sea-surface temperature of 104°F. Note that the boundary of Yellowstone National Park is shown in the center of the figure near 44°N and 114°W and the Great Salt Lake is shown near 41°N and 112°W. The West Coast near Seattle is shown in the upper left-hand corner of the figure. The total accumulated precipitation over the ten-day period is displayed in millimeters of equivalent liquid precipitation in various colors according to the legend at the bottom of the figure.
The main region of precipitation in and around Yellowstone National Park occurred along the continental divide, which runs northwestward from Colorado along the Wind River Range in Wyoming and through the southwest corner of the park. Farther south, a region of moderate precipitation occurred along the Wasatch Mountains in eastern Utah and along the mountains of southern Utah and northern Arizona near Grand Canyon. The heaviest precipitation for this series of storms occurred over the Pacific Ocean and along the West Coast. The magnitude of precipitation in the park reached about 40 inches (~1,000 mm) and about 80 inches (~2,000 mm) over the ocean.
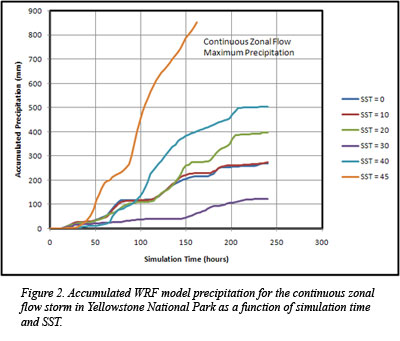 Figure 2 shows the accumulated WRF model precipitation for the continuous zonal flow storm in Yellowstone National Park as a function of simulation time and sea-surface temperature. Precipitation accumulated more rapidly for the warmest sea-surface temperatures, somewhat similar to what Brewer and I reported for Yosemite National Park.2,3 The increased accumulation rates at the warmer temperatures were expected, since the rate of growth of snow in clouds and the formation of precipitation are governed by a strong function of sea-surface temperature. However, in Yellowstone, the accumulation rate is a complex function of temperature, which indicates that some other factor is also important. Brewer and I suggested that convection over the Pacific Ocean and along the West Coast and sinking air over the intermountain region modified this relationship.4 Only at the warmest sea-surface temperatures, above about 86oF, does the strong function of sea-surface temperature dominate.
There are several important consequences to these dual driving forces on the accumulation of precipitation during the Ice Age: 1) storms crossing the coastline and mountain barriers close inland would produce high accumulation rates that are strongly proportional to seasurface temperature; 2) storms crossing the intermountain region would produce high accumulation rates on mountain barriers for sea-surface temperatures warmer than about 86°F; 3) accumulation rates on mountain barriers more than a hundred miles inland from the coastline would be reduced somewhat for cooler sea-surface temperatures; and 4) precipitation would be greatly depressed in valleys and on plateaus inland from the coastline and downwind of mountain barriers.
The reduction of precipitation downwind of mountain barriers occurs today along and downwind of the Sierra Nevada and the Rocky Mountains and is known as the rain shadow effect. However, during the Ice Age this effect would have been even greater. It may have led to the hypothesized ice-free region between the Cordilleran ice sheet along the coastal mountains of British Columbia and North America, and the Laurentide ice sheet of central Canada. This ice-free corridor has long been believed to have been the path that Ice Age man used to migrate southward on the North American continent from Beringia to Central and South America. These simulations appear to support this view of conditions during a rapid ice age.
Increased Glacier Growth
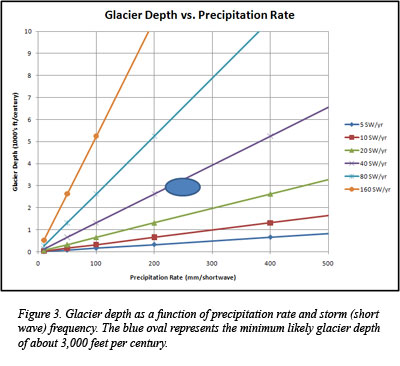 Figure 3 shows glacier depth as a function of precipitation rate and frequency of storms in Yellowstone National Park. Notice that glacier thickness is a function of precipitation rate, frequency of storms, and the length of an ice age. The blue oval represents a region of average conditions that likely occurred during an ice age with a warm ocean. Since precipitation rate is a function of sea-surface temperature and storm frequency is a function of the location of the jet stream, it appears that the presence of glaciers in Yellowstone National Park during the Ice Age can easily be explained by warm sea-surface temperatures and a more southerly position of the jet stream. Glacier depth could have easily exceeded about 3,000 feet per century.
Conclusions
Glaciers thousands of feet thick could have readily developed in the mountains in and around Yellowstone National Park during the hundreds of years following the Genesis Flood. Glaciers filled Yellowstone Lake, topped many of the mountains, and flowed down the canyons and valleys in and around Yellowstone. The glaciers in Yellowstone were estimated to be a minimum of 3,000 feet thick for sea-surface temperatures warmer than 86°F over the period of a century.
Precipitation in the intermountain valleys and plateaus decreased significantly in the simulations, magnifying the difference in precipitation between the mountains and the valleys. This “rain shadow” effect not only occurred downwind of mountain barriers, but also within a hundred miles or so of the coastline. The cause for this effect was hypothesized to be increased convection and rising motions over the ocean, with descending motions inland. These model results support the theory that an ice-free zone extended from north to south in western Canada and the northwestern United States, separating the Cordilleran and Laurentide ice sheets and allowing Ice Age immigration from Beringia to Central and South America. The difference from the conventional theory is that this happened in just a few hundred years after the Genesis Flood because of the extreme precipitation rates caused by the warm oceans.
References
- Vardiman, L. 2010. An Ice Age in Yosemite National Park. Acts & Facts. 39 (3): 12-13.
- Vardiman, L. and W. Brewer. 2010. Numerical Simulation of Precipitation in Yosemite National Park with a Warm Ocean: A Pineapple Express Case Study. Answers Research Journal. 3 (2010): 23-36.
- Vardiman, L. and W. Brewer. 2010. Numerical Simulation of Precipitation in Yosemite National Park with a Warm Ocean: Deep Upper Low and Rex Blocking Pattern Case Studies. Answers Research Journal. 3 (2010): 119-145.
- Vardiman, L. and W. Brewer. 2010. Numerical Simulation of Precipitation in Yellowstone National Park with a Warm Ocean: Continuous Zonal Flow, Gulf of Alaska Low, and Plunging Western Low Case Studies. Answers Research Journal. 3 (2010): 209-266.
- Austin, S. A. et al. 1994. Catastrophic Plate Tectonics: A Global Flood Model of Earth History. Proceedings of the Third International Conference on Creationism. Walsh, R.E., ed. Pittsburgh, PA: Creation Science Fellowship, 609-622.
- Crowley, T. J. and G. R. North. 1991. Paleoclimatology. Oxford Monograph on Geology and Geophysics, No. 18. New York: Oxford University Press, 71-91.
- The Weather Research & Forecasting Model. Posted on wrf-model.org.
* Dr. Vardiman is Senior Research Scientist, Astro/Geophysics, at the Institute for Creation Research.
Cite this article: Vardiman, L. 2010. An Ice Age in Yellowstone National Park. Acts & Facts. 39 (12): 12-14.