PATTERNS OF OCEAN CIRCULATION OVER THE CONTINENTS DURING NOAH'S FLOOD
Click on any of the figures below to get a larger image.
|
Figure 1. Computational mesh constructed from icosahedron. Mesh has 40962 nodes. Nodes are located at centers of hexagonal cells. Node spacing is about 125km.
|
|
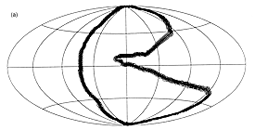
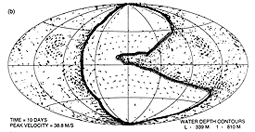
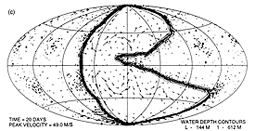
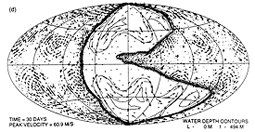
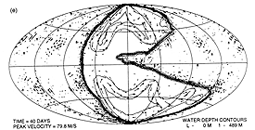
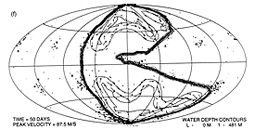
Figure 2. Snapshots from solutin of the shallow water equations for a bottom topography corresponding to a Pangean-like continent initially flooded to a depth of 500 meters. Initial water depth contours are shown in (a) with the minimum contour equal to 500 m and the maximum contour equal to 3980 m. The initial velocities are everywhere zero. Frames (b) - (g) show the solution at 10-day intervals.
|
 |
 |
 |
 |
 |
 |
|
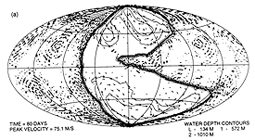
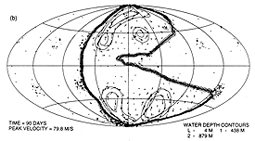
Figure 3. Snapshots at 80 days (a) and 90 days (b) from calculation identical to that of Fig. 2 except initial water depth over the continent is 1000 m and over oceanic regions is 3680 m. Solution displays strong time vatiation.
|
 |
 |
|
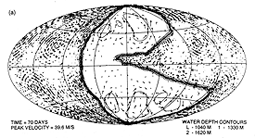
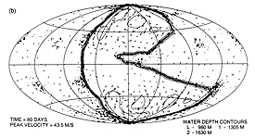
Figure 4. Snapshots at 70 days (a) and 80 days (b) from calculation identical to that of Fig.2 except initial water depth over the continent is 1500 m and over oceanic regions is 3380 m. Solution displays moderate time vatiation.
|
 |
 |
|
Figure 5. Snapshot at a time of 80 days from a solution of the shallow water equations with a bottom topography consisting of a circular continent 5560 km in diameter centered at 45 degrees latitude in each hemisphere and initially flooded to a depth of 1000 meters. Initial water depth in the oceanic areas is 3000 m.
|
|
Figure 6. Snapshot at 40 days for a case identical to that of Fig. 5 except the continent diameter is 3330 km and the initial flooding depth is 250 m.
|